
Nationally, pending home sales dropped 6% last month, creating a winter standoff that has buyers second-guessing their moves despite mortgage rates sitting near three-year lows. Fewer homes are going under contract, and the ones that do are taking longer to get signed deals — a reality that contradicts what many expected when rates started easing. This cooling happens while sellers maintain firm price expectations and pull back on new listings, creating a market where both sides wait for the other to blink first. You deserve to understand what's really driving this hesitation beyond the obvious winter slowdown, and more importantly, where you can find negotiating power in a market that seems frozen. This article breaks down the key numbers that matter most — sale-to-list ratios, homes selling above asking price, and metro-level variations that reveal where demand still exists versus where it's completely stalled. You'll learn to interpret mixed headlines that show weekly contract trends dropping sharply around 6% while monthly indexes appear milder, both pointing to the same underlying cooling behavior. We'll examine specific indicators that signal whether this pause represents a temporary winter lull or deeper affordability pressures that could reshape your spring buying strategy. The data reveals clear patterns about where buyers maintain leverage for concessions, below-ask offers, and extended timelines, plus which markets buck the national trend. What signals should you watch to determine if spring will bring the rebound everyone hopes for?
The 60 second housing dashboard you can use today
This dashboard gives you the essential numbers to scan quickly and apply directly in your next conversation with agents or when making offers.
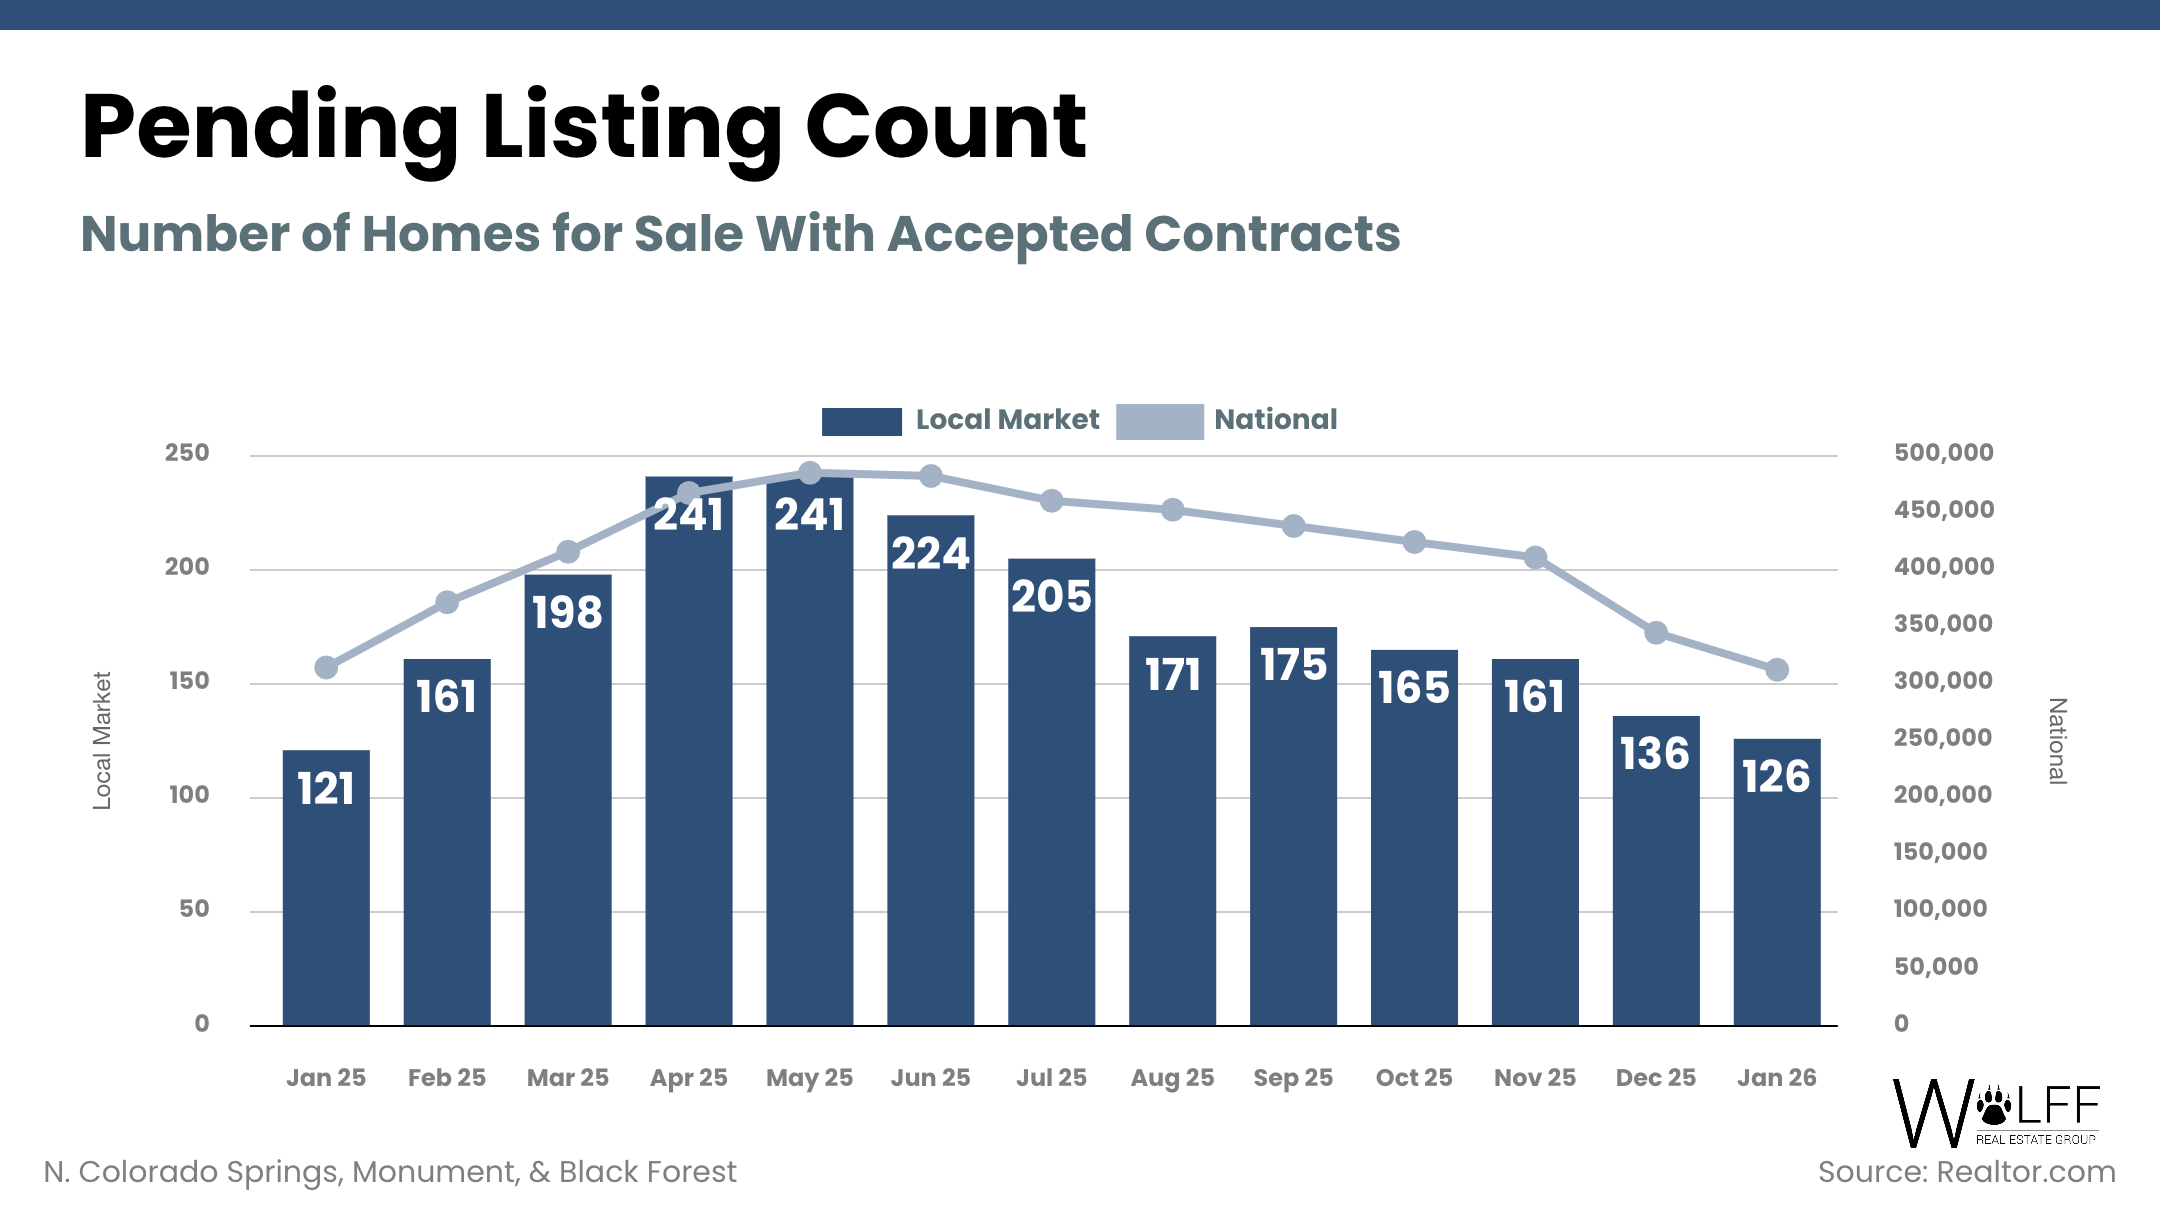
Pending home sales snapshot
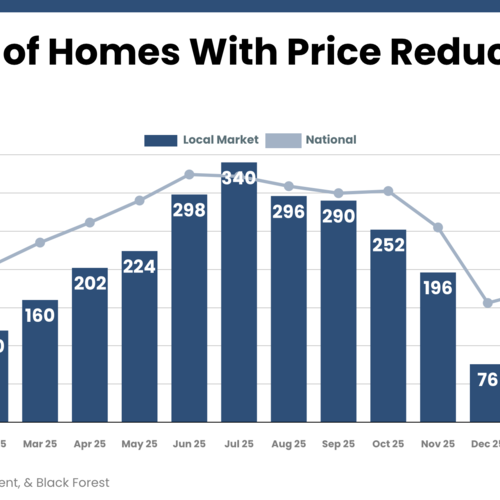
Contract activity has slumped significantly, with the National Association of REALTORS reporting a sharp decline that reflects weakening buyer commitment across most regions. This retreat from the market demonstrates how winter conditions amplify existing affordability concerns, creating a compound effect that keeps potential buyers from moving forward with purchases they might otherwise consider.
- Weekly contract trends show approximately 6% fewer signed agreements compared to recent periods
- January 2026 PHSI dropped 0.8% month-over-month and 0.4% year-over-year
- Current index represents the lowest reading since 2010, marking a 16-year low point
Affordability anchors driving hesitation
Lower borrowing costs haven't translated into meaningful payment relief for most households, as home prices remain stubbornly high despite reduced competition. NAR Chief Economist Dr. Lawrence Yun notes that "improving affordability conditions have yet to induce more buying activity," highlighting the disconnect between rate improvements and actual purchasing power.
- Current mortgage rates hover around 6.09%, representing a three-year low
- Median monthly payments still reach approximately $2,601 despite rate decreases
Supply & competition temperature check
Housing inventory has expanded to 4.2 months of available supply, providing buyers with more options and reducing the frantic pace that characterized recent years. This shift means you can take additional time to evaluate properties, request inspections, and negotiate terms without facing immediate pressure from competing offers.
- Inventory levels reach 4.2 months of supply, up from tighter conditions last year
- Expanded selection gives buyers enhanced negotiating position and decision-making time
Quick negotiation cues (save this for your next call)
- Sale-to-list ratio trends — When properties consistently sell below asking price, request 3-5% reductions from initial offers and expect counteroffers rather than immediate rejections.
- Above-list sales frequency — Track how often homes sell above asking in your target area; declining percentages signal you can submit offers at or below list price with confidence.
- Seller concession patterns — Ask agents about recent closing cost assistance, repair credits, or rate buydowns; increased concession frequency means sellers are more willing to absorb transaction costs.
- Time-on-market extensions — Properties sitting longer than 30 days indicate motivated sellers who may accept lower offers or additional buyer requests for repairs and upgrades.
Monitoring these indicators now positions you to recognize when spring market conditions shift and buyer leverage either strengthens or diminishes.
Why buyers are backing off even with lower rates
Multiple headwinds converge to create a perfect storm of buyer hesitation that defies the conventional wisdom about rate relief spurring demand. Mortgage costs have dropped to their most attractive levels in three years, yet households remain reluctant to commit to home purchases, creating a disconnect between financial opportunity and actual market activity. This phenomenon stems from several compounding factors that work together to suppress contract signings despite improved borrowing conditions.
Monthly housing expenses continue to strain family budgets even with reduced interest rates, as property values and associated costs maintain their grip on affordability calculations. When families calculate their total housing burden, they face property taxes that have increased alongside home values, insurance premiums that reflect rising replacement costs, and maintenance expenses that compound the financial commitment. Dr. Lawrence Yun, NAR Chief Economist, observes that improving affordability conditions have yet to induce more buying activity, highlighting how technical qualification improvements don't necessarily translate into comfortable payment scenarios for real families. More households can technically afford to buy compared to last year's conditions, yet many remain hesitant to stretch their budgets for what still represents a substantial financial commitment.
Cold temperatures and shortened daylight hours create practical barriers that reduce the volume of serious house-hunting activity during winter months. Prospective buyers cancel scheduled property viewings when snow storms hit, real estate agents postpone open houses due to icy conditions, and home inspectors reschedule appointments because of weather-related access issues. These seemingly minor disruptions accumulate into measurable reductions in signed purchase agreements, as the physical process of evaluating and securing properties becomes more cumbersome. Families with children face additional scheduling constraints during the school year, limiting their ability to dedicate weekends to intensive property searches that typically precede contract decisions.
Economic volatility functions as an invisible tax on major financial decisions, causing employed buyers to pause even when their job security appears stable. First-time purchasers demonstrate particular sensitivity to payment amounts, often choosing to delay purchases rather than commit to monthly obligations that consume large portions of their income. These buyers frequently possess steady employment and adequate savings for down payments, yet they hesitate to lock themselves into long-term debt during periods of broader economic uncertainty. Their caution reflects a rational response to mixed economic signals, where positive employment data coexists with concerns about inflation, interest rate volatility, and potential recession risks.
Tracking specific market signals will reveal whether spring conditions generate the buyer re-engagement that many industry participants expect. Watch for increases in mortgage application volumes, which typically precede contract activity by several weeks, and monitor whether inventory levels continue expanding or begin stabilizing as seller confidence returns. Temperature readings on buyer urgency — measured through metrics like average days from first showing to contract signing — will indicate whether the current standoff represents temporary seasonal cooling or deeper structural hesitation about homeownership commitments.
I notice that no source link or source content summary was provided in your request. The and sections are empty. Without this information, I cannot determine which text in the section would be relevant to link or what content the source supports.
Please provide the source link and source content summary so I can add appropriate external linking to the section.
Who has leverage right now and how to spot it in the numbers
Power dynamics have shifted decisively toward purchasers across numerous regional markets, and you can confirm this transformation by examining four key data points — available housing stock measured in months, the speed at which properties move from listing to signed contract, how close final sale prices land to original asking amounts, and the frequency of bidding wars that push prices beyond list value. Using NAR month-supply data, the housing market is "the most balanced it's been in almost a decade."
The buyer-leaning signals (and what each one lets you ask for)
These concrete indicators reveal where you hold negotiating strength and exactly what concessions become reasonable to request when the data supports your position.
- Months of housing supply above 3.5 — When inventory climbs beyond this threshold, sellers face genuine competition from other available properties, creating space for you to request closing cost assistance ranging from 2-4% of the purchase price, demand specific repairs identified during inspection, or negotiate rate buydown arrangements where sellers contribute toward reducing your mortgage interest.
- Extended contract signing periods beyond 45 days — Properties that sit without signed agreements for six weeks or longer signal motivated sellers who become more receptive to below-asking offers, flexible closing dates that align with your timeline, and additional contingencies that protect your interests during the transaction process.
- Sale-to-list ratios dropping below 98% — When homes consistently close for less than their advertised price, you gain justification for submitting offers 3-7% under asking price, requesting seller-paid inspections, and asking for appliance or fixture inclusions that weren't part of the original listing package.
- Above-list sales occurring in fewer than 20% of transactions — Reduced bidding war frequency means you can take time for thorough property evaluation, include inspection contingencies without fear of losing competitive advantage, and negotiate repair credits rather than accepting properties in as-is condition.
- Increased concession prevalence in recent closings — When agents report rising instances of seller-provided credits, repair allowances, or rate assistance, you can confidently request similar arrangements and expect productive counteroffers rather than outright rejections.
Why it still feels uneven on the ground
Market leverage doesn't distribute uniformly across all properties or sellers, creating a patchwork of negotiating conditions that varies dramatically based on individual circumstances and motivations. Sellers who purchased their current homes years ago with low mortgage rates often possess the financial flexibility to wait for their ideal buyer and price, maintaining firm positions on terms and refusing to engage in meaningful negotiations. These homeowners can afford to let their properties sit on the market for extended periods, withdraw listings during slow seasons, and relist when conditions improve.
Meanwhile, sellers facing job relocations, divorce proceedings, estate settlements, or financial pressures must move forward with transactions regardless of market conditions, creating pockets of opportunity where buyer leverage becomes pronounced. These motivated sellers demonstrate willingness to accept below-market offers, provide substantial concessions, and accommodate buyer preferences for closing timelines and contingencies. The challenge lies in identifying which category each potential seller falls into before making offers or negotiation requests.
What's actually winning right now (agent reality check)
> "Buyers have a little more leeway; sellers have to be more flexible, and that's a big shift from the pandemic years when sellers had nearly all the leverage."
This fundamental change in market dynamics means successful transactions now depend on realistic pricing strategies, accommodating buyer schedules for inspections and appraisals, and willingness to contribute toward transaction costs that buyers previously absorbed independently. Recognizing these leverage indicators before submitting offers allows you to structure requests that align with current market realities rather than outdated assumptions about seller control.
Where the market is still moving and where it is freezing over
Geography determines your negotiating power more than any other factor right now, as contract activity splits dramatically across regions while national averages mask the real story of where demand persists versus where it has essentially stopped. Understanding these regional patterns helps you identify whether your target area offers buyer advantages or requires seller flexibility, directly influencing your spring timing decisions and offer strategies.
Recent contract data reveals a stark divide in monthly momentum across the country. Northeast: pending sales dropped 5.7% from December to January, reflecting harsh winter conditions and persistent affordability challenges that keep potential buyers away from showings and contract signings. South: activity declined 4.5% month-over-month despite traditionally milder weather, suggesting deeper hesitation beyond seasonal factors. Midwest: contracts increased 5.0% during the same period, bucking national trends as buyers capitalized on expanded inventory and competitive pricing. West: pending sales rose 4.3% month-over-month, driven by rate-sensitive purchasers returning to markets they had previously abandoned.
Annual comparisons paint an even more complex regional picture that reveals which areas maintain underlying strength versus those experiencing fundamental demand erosion. Northeast: year-over-year pending sales plummeted 8.3%, marking the steepest decline among all regions and signaling persistent structural challenges beyond winter weather impacts. Midwest: annual activity fell 3.3% despite monthly gains, indicating recent improvements haven't overcome longer-term headwinds. South: contracts climbed 4.0% compared to January 2025, demonstrating sustained buyer interest even as monthly numbers softened. West: year-over-year growth reached just 0.3%, suggesting the region has stabilized after previous volatility but hasn't achieved robust expansion.
Several metropolitan areas defy the broader cooling trend, posting double-digit annual gains that reveal where specific local conditions create buyer urgency. Phoenix leads with 11.8% year-over-year growth, while Boston achieved 10.7% increases despite Northeast regional weakness, and Charlotte matched that performance at 10.7% annual growth. San Francisco posted 8.9% gains, Oklahoma City reached 8.7% growth, and additional metros like San Diego, San Antonio, and Miami continue registering solid increases while surrounding areas stagnate.
These outperforming markets share three critical characteristics that explain their resilience during broader slowdowns. Each area maintains inventory levels that provide buyers with meaningful choice without creating oversupply concerns, allowing for normal negotiation processes rather than bidding wars or immediate rejections of reasonable offers. Housing costs in these metros align more favorably with local income levels compared to severely stretched markets, enabling qualified buyers to secure financing without extreme budget strain. Rate-sensitive purchasers who had stepped away from homebuying during higher borrowing cost periods have returned as conditions improved, creating renewed competition that supports contract activity.
Tracking your specific region's position within this national split determines whether you should expect seller concessions, prepare for competitive offers, or plan for extended negotiation timelines when spring arrives.
What to do next and the simple spring watchlist
Current regional variations create distinct opportunities based on your transaction timeline and local market conditions. Here's what to do depending on whether you're buying or selling soon.
If you're buying in the next 30–90 days
- Capitalize on winter's reduced competition by requesting seller contributions toward closing costs, mortgage rate buydowns, and necessary repairs — particularly on properties that have lingered without offers for 30 days or longer. Stale listings represent your strongest negotiating position, as motivated sellers often accept terms they would have rejected during busier seasons.
- Target your search in areas where inventory continues expanding and multiple-offer situations have disappeared, as your bargaining power materializes fastest in these shifting conditions. Markets experiencing rising supply levels give you time to conduct thorough inspections, compare multiple properties, and submit offers below asking price without immediate rejection.
If you're selling this winter or early spring
- Set your listing price based on recent comparable sales rather than peak market values, and ensure your property presents as move-in ready to minimize days on market. Buyers in the current environment gravitate toward homes requiring minimal immediate investment, making cosmetic updates and repairs essential for quick contracts.
- Prepare for increased buyer requests for concessions when local supply reaches 4 months or higher, including closing cost assistance, repair credits, and flexible terms. These requests become standard rather than exceptional when inventory levels provide buyers with abundant alternatives to your property.
The simple spring watchlist (3 leading indicators)
Monitor these three data points to gauge whether seasonal recovery will materialize as expected.
- Mortgage rates holding near 6% or declining further — Borrowing costs that remain stable around current levels or drop toward 5.8% typically encourage rate-sensitive buyers to re-enter the market after extended waiting periods.
- Purchase mortgage applications reaching elevated levels — Application volumes often precede actual contract signings by 3-4 weeks, making this metric a reliable predictor of pending sales increases. Current applications sit near three-year highs, suggesting potential contract growth ahead.
- Touring and search demand trends showing sustained increases — Online search activity, showing requests, and open house attendance provide early signals of buyer engagement before formal offers materialize.
When two or three of these indicators move upward simultaneously for several consecutive weeks, contract activity typically follows within a month. This confirmation pattern helps distinguish genuine market shifts from temporary fluctuations caused by weather or isolated events.
Tracking inventory growth alongside demand recovery reveals the complete spring picture. Mortgage rates are forecast to average 6.3% through 2026, while active listings are projected to increase 8.9% compared to current levels. More available homes can limit price acceleration even when buyer activity strengthens, creating a balanced environment where neither buyers nor sellers hold overwhelming advantage. Use this watchlist to calibrate your expectations rather than assuming spring automatically brings dramatic market changes.
Final Thoughts
The housing market sits frozen in a winter standoff where buyers demand affordability relief while sellers cling to yesterday's prices. Despite mortgage rates dropping to three-year lows, pending home sales slipped 6% as monthly payment burdens and economic uncertainty continue killing buyer confidence. This data reveals more than seasonal slowdown - it exposes the fundamental disconnect between what buyers can afford and what sellers expect.
You now possess the tools to navigate this stalled market effectively. The negotiation indicators we've examined - sale-to-list ratios, homes selling above asking price, and extended contract timelines - give you concrete signals about where leverage lies. Inventory improvements create opportunities for strategic buyers willing to negotiate concessions, below-ask offers, and extended closing periods. Metro-level variations show demand isn't dead everywhere, just selective.
This information empowers you to make confident decisions rather than guessing about market direction. Buyers gain clarity on negotiating power and timing strategies. Sellers receive realistic expectations for pricing and marketing duration in tepid demand conditions. Both sides can monitor purchase applications and real-time demand signals to anticipate whether spring brings market thaw or prolonged waiting.
Your next move matters. Buyers should negotiate strategically now while inventory builds and seller motivation increases. Sellers must price competitively and present properties attractively to avoid sitting unsold into spring. Watch mortgage rates, application volumes, and local demand indicators closely. The market rewards those who act on data rather than hope. Make your decision based on facts, not fear.
Check out this article next